
Project Type
Site Architecture and UX Design
3 Months
Team
Brendan Reynolds
Ryan Homberg
Mikel Mccavana
Role
Researcher, Designer, Presenter
Overview
We were engaged by a leading financial technology company to create the future vision for its flagship product: a digital portfolio monitoring tool for private equity firms. Unlike other investments, private equity firms have to collect financial information directly from the entities in which they invest to determine their value. Our client’s product was meant to streamline that process by systematically analyzing financial information from private equity firms’ investments, and displaying all this information as a “single source of truth” for a firm’s analysts and executives.
Goals
Our client had three key business goals for the future of this product:
Increase adoption within their clients’ organization by making it easier to use for their executives and front office workers
Expand their client base by making the product adaptable to more client scenarios
Minimize the product setup time for each client
Discovery
The product had three different types of users:
The implementation team who initially setup the system for the client
Product managers who maintained the data, created visualizations, and generated reports
Front office workers who were in the private equity firm that wanted to monitor and analyze their investments
Unable to interview customers directly, we interviewed 20 key stakeholders who were users of the platform to learn about the current state of the product and the private equity industry in generaI. These interviews helped us create a high-level user journey that we mapped the product’s pain points against and used for an issue prioritization workshop with our client and arrived at a set of key problems we agreed needed to be solved.

Pain points
Disorienting product architecture
The product was organized around the action the user wanted to perform rather than the investments and the relationship between them. This forced the user to choose an action - whether it be to create, edit, or view - and then the investment they wanted to take that action on. Since users of this platform had many tasks to accomplish on many different investments within their work day this particular architecture was both inefficient and disorienting.
Limited investment categories
The product only had two categories of investment - funds and assets - despite private equity firms having more complex investment structures with multiple paths of ownership. This limitation meant that clients often had to use complex workarounds to simulate their actual investment hierarchies.
These complex workarounds led to many other problems:
The implementation team had to create unique custom-built setups that were not only costly but made clients wait many months until they could use the product
Front-office users couldn’t understand the manual workarounds, making them reliant on product managers to routinely pull data for front-office users
Product managers often created data visualizations that were incorrect or broken because investment structures were labeled incorrectly or unclearly
Static data visualizations
All of the product’s data visualization were hard-coded and static in nature. The inability to manipulate this data was problematic as executives often wanted to see specific data sets quickly and did not have the technical ability to create a visualization themselves. This pushed the responsibility to the product manager leaving them frustrated and overworked.
Process
As novices in the private equity world, we tapped our client’s deep knowledge of the private equity world and the users of their product through directed sketching exercises. In bringing them through a variety of user scenarios in the form of “How might we” statements we established an initial direction for our first round of concepts.

Solutions
Working closely with the client’s lead designer we continued to iterate on low-fidelity, wireframe concepts and tested with the client product team. Through multiple rounds of feedback and iteration we arrived at a set of targeted solutions to the product’s core pain points.
Simplified product architecture
To accomplish this we established a product architecture that could be configured to resemble each client’s investment hierarchy. Each type of investment (fund, company, building, etc) would have it’s own “finder page” that would allow the client to view the investments of that type, their key metrics, and preset visualizations. From this page, product managers could launch into flows to edit, update, create new visualizations, and generate reports for the investment type they were viewing.

The reorganization of the platform enabled front office workers to find and navigate through their investments more easily and the inclusion of actions on these pages created a simpler workflow for product mangers.
More investment categories and improved grouping functionality
In order to allow the product to support custom investment categories the implementation team would need to assign each investment type its own data elements and attributes. The standardization of data elements meant that inputting future investments would be easier, data visualization would be more reliable, and front office workers could filter and sort their investments based on complex criteria. Based on conversations with stakeholders we learned that front office workers would often be interested in viewing data related to investments that meet specific criteria (such as net profit over $100k in the last 12 months) or a predetermined subset of investments (such as the investments they were personally responsible for).
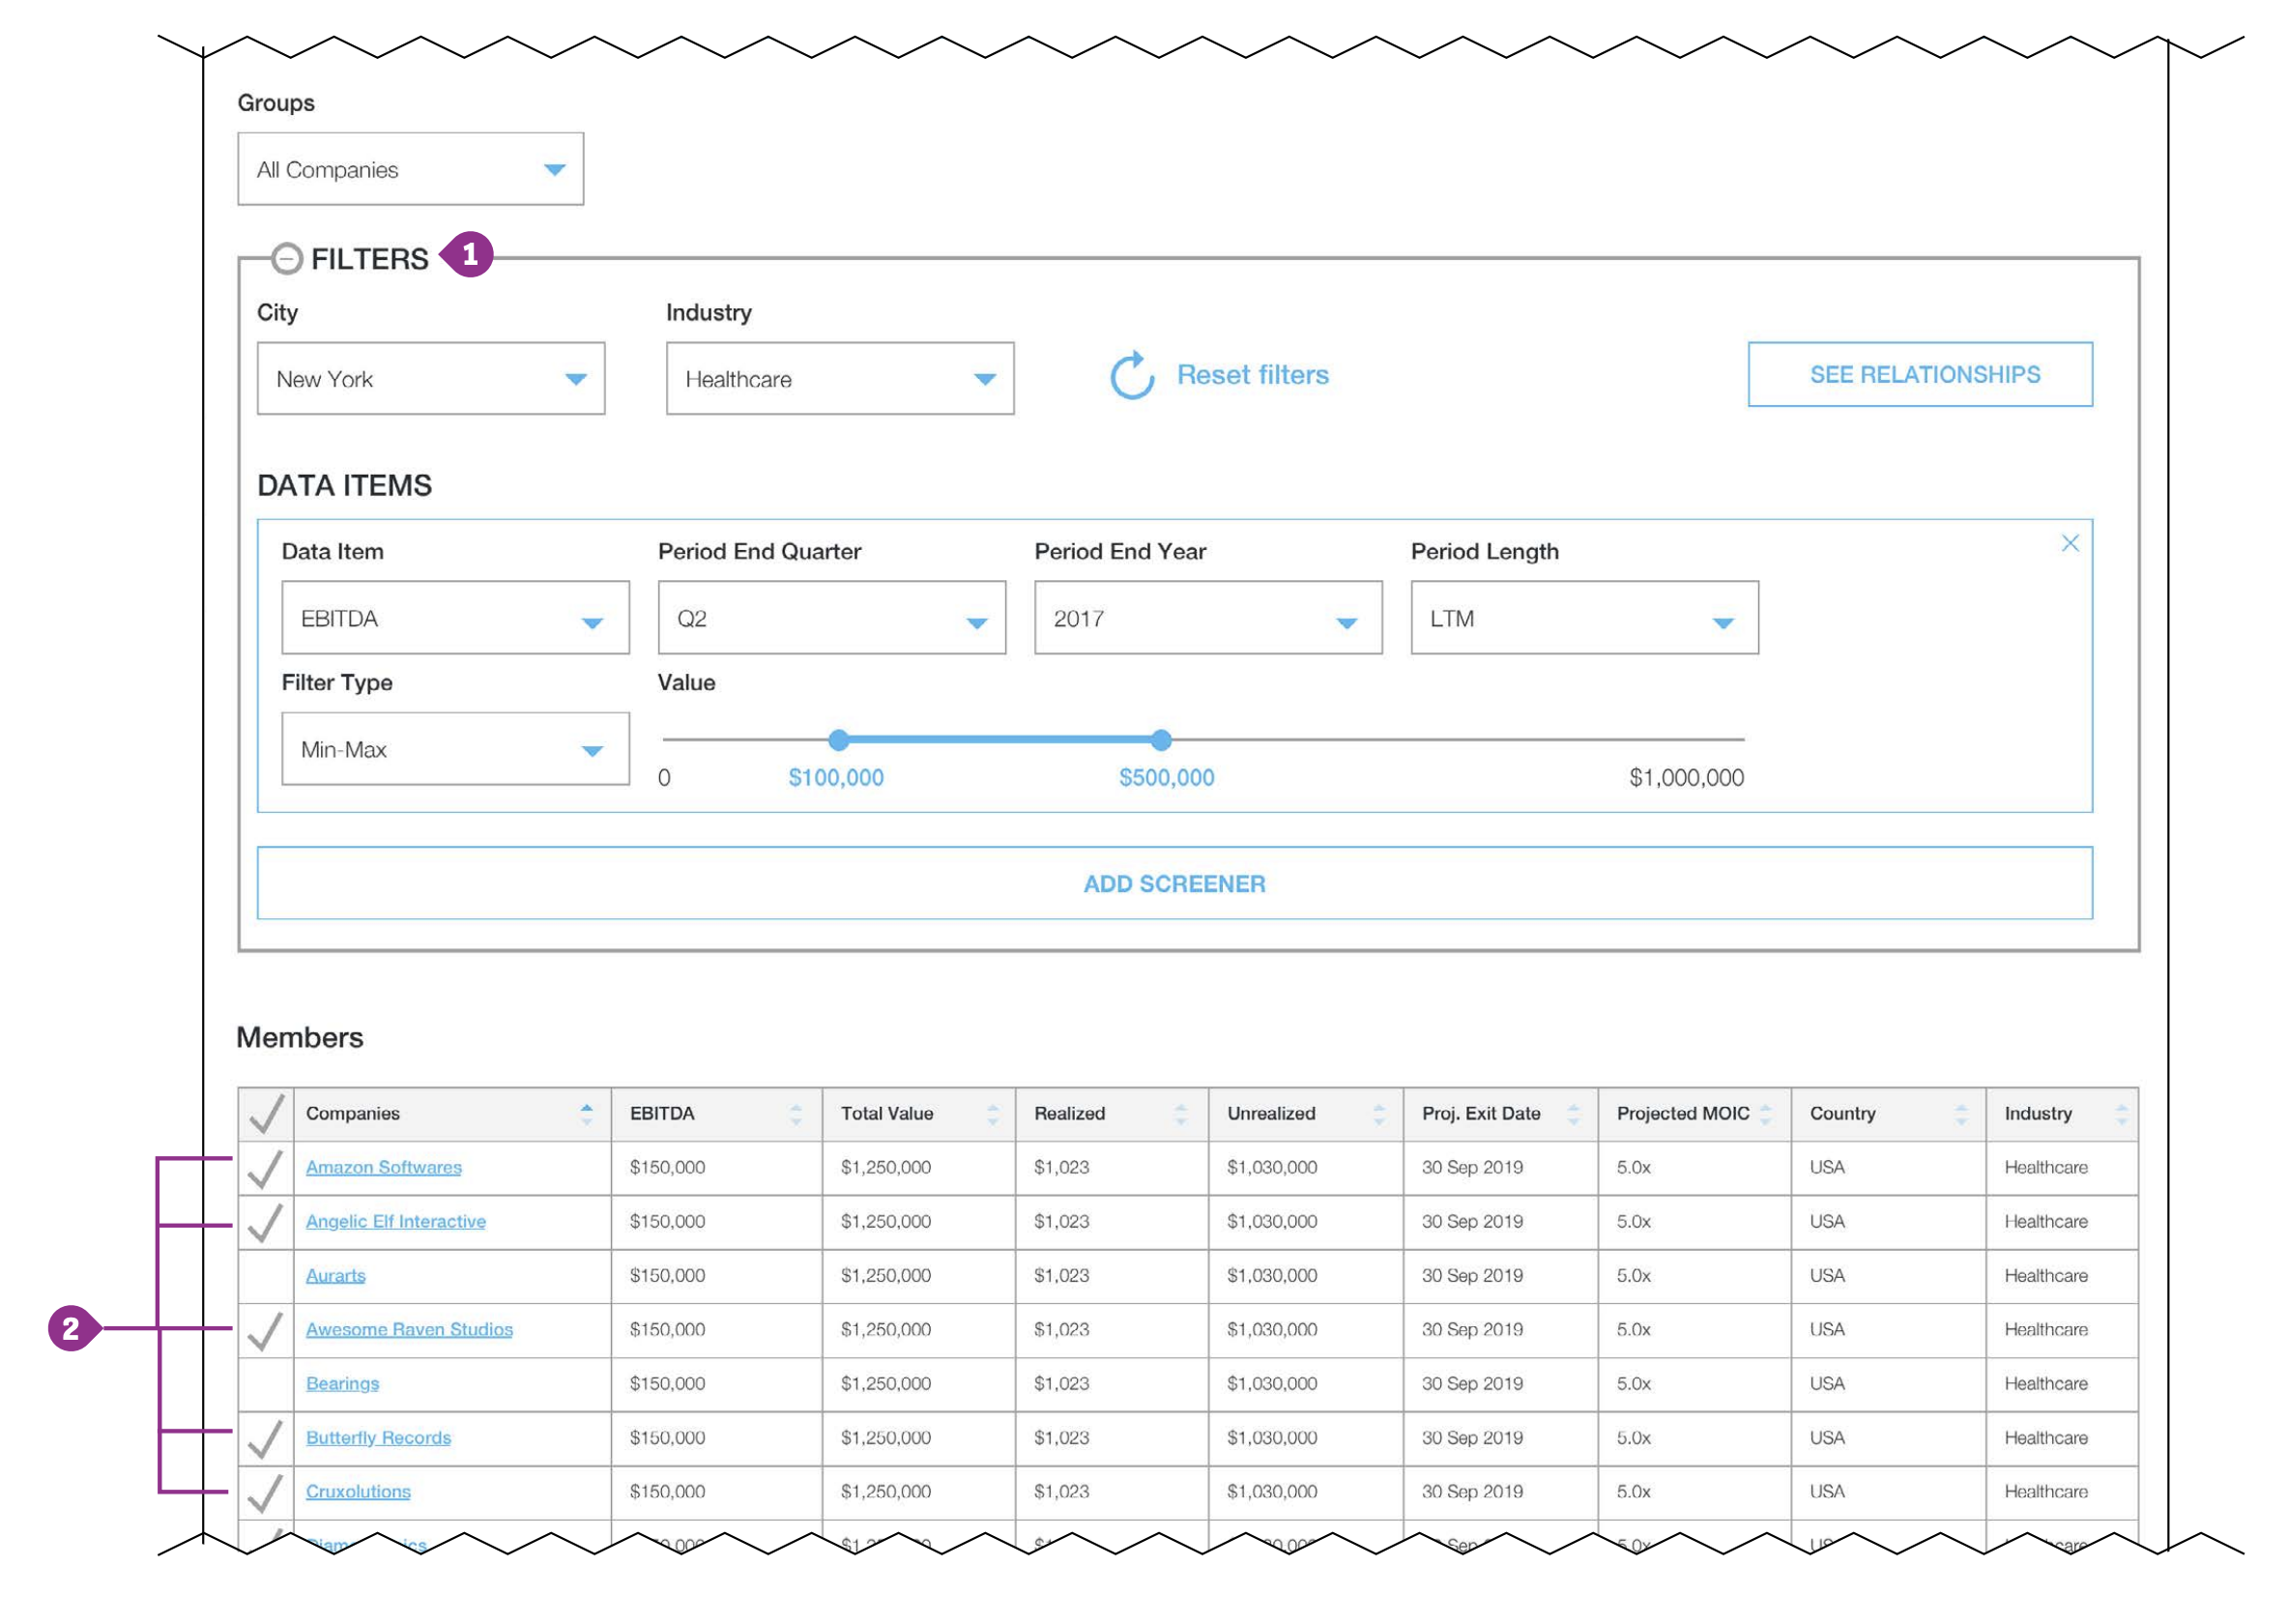
To make these repeated inquiries more accessible we allowed users to save two different types of groups through two different interactions:
Users could set filters on a series of data items to access a dynamic list of investments
Users could individually select a set of investments via checkboxes
Dynamic data visualizations
As stated earlier, data visualizations are extremely important to front office workers. The standardization of data elements did improve the odds of product managers creating new data visualization reliably but did not decrease the reliance on product managers to create new visualizations. To address this, we proposed that the product managers would initially configure and place data visualizations for the page but the data visualization would be driven by the data set specified by the screeners and manual selection of entities on the page.
For example, a platform manager may decide that the “Finder” page for companies should display IRR and MOIC visualizations. If a user wanted to see either of those metrics for all New York based companies with an EBITA between $100-500k in the last 12 months, they could use the data and attribute filters to narrow down the companies displayed, and the data visualizations below would reflect that filtered set of companies.

By letting platform managers pre-set data visualizations that non-expert users could easily manipulate, we aimed to reduce platform managers’ workloads, increase usage from executives and front-office employees, and keep important data management in the hands of power users.